Using a PHP debugger such as Xdebug along with an IDE such as PHPStorm can simplify troubleshooting complex problems. Xdebug offers a helpful stacktrace and can integrate with an IDE allowing you to set up breakpoints and evaluate the application state within the IDE. To install Xdebug, you’ll need to have your PHP configuration information, call phpinfo(); and copy/paste the output into Xdebug’s install wizard. The wizard will give you a detailed set of instructions to install Xdebug in your environment, and can allow you to verify the installation by copying the output of phpinfo(); after installation.
After Xdebug is installed you will want to make sure you have remote debugging enabled. To do so, add “xdebug.remote_enable=1” to your php.ini file.
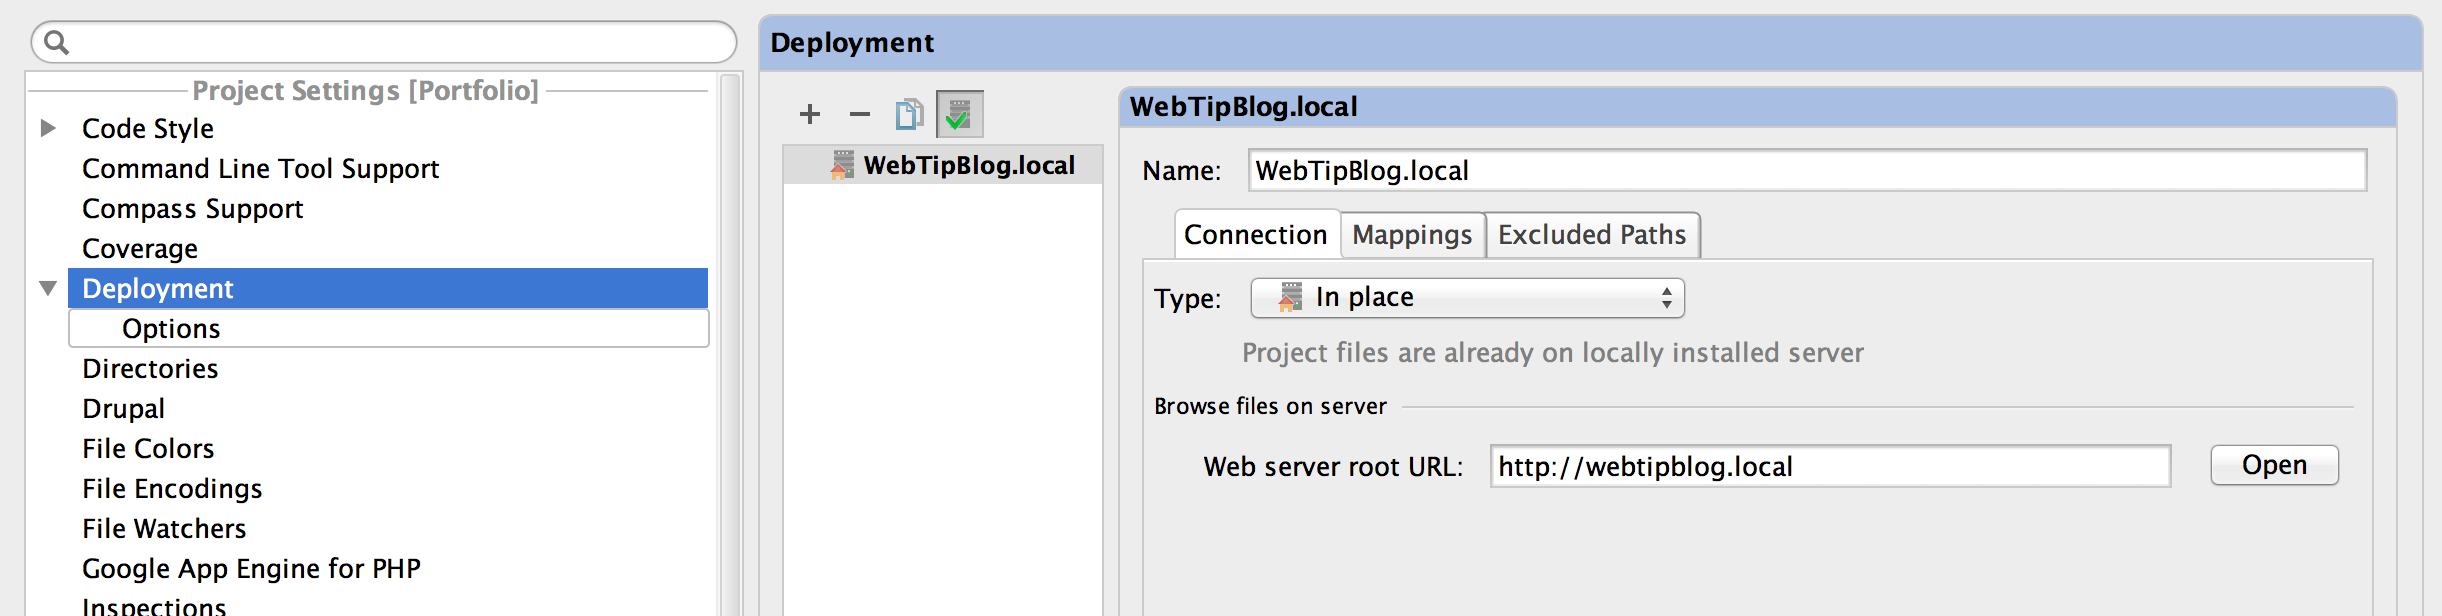
After you have Xdebug installed you must configure PHPStorm for debugging. The first step within PHPStorm is to configure the deployment server. To do this go to Preferences->Deployment and configure this to your environment.
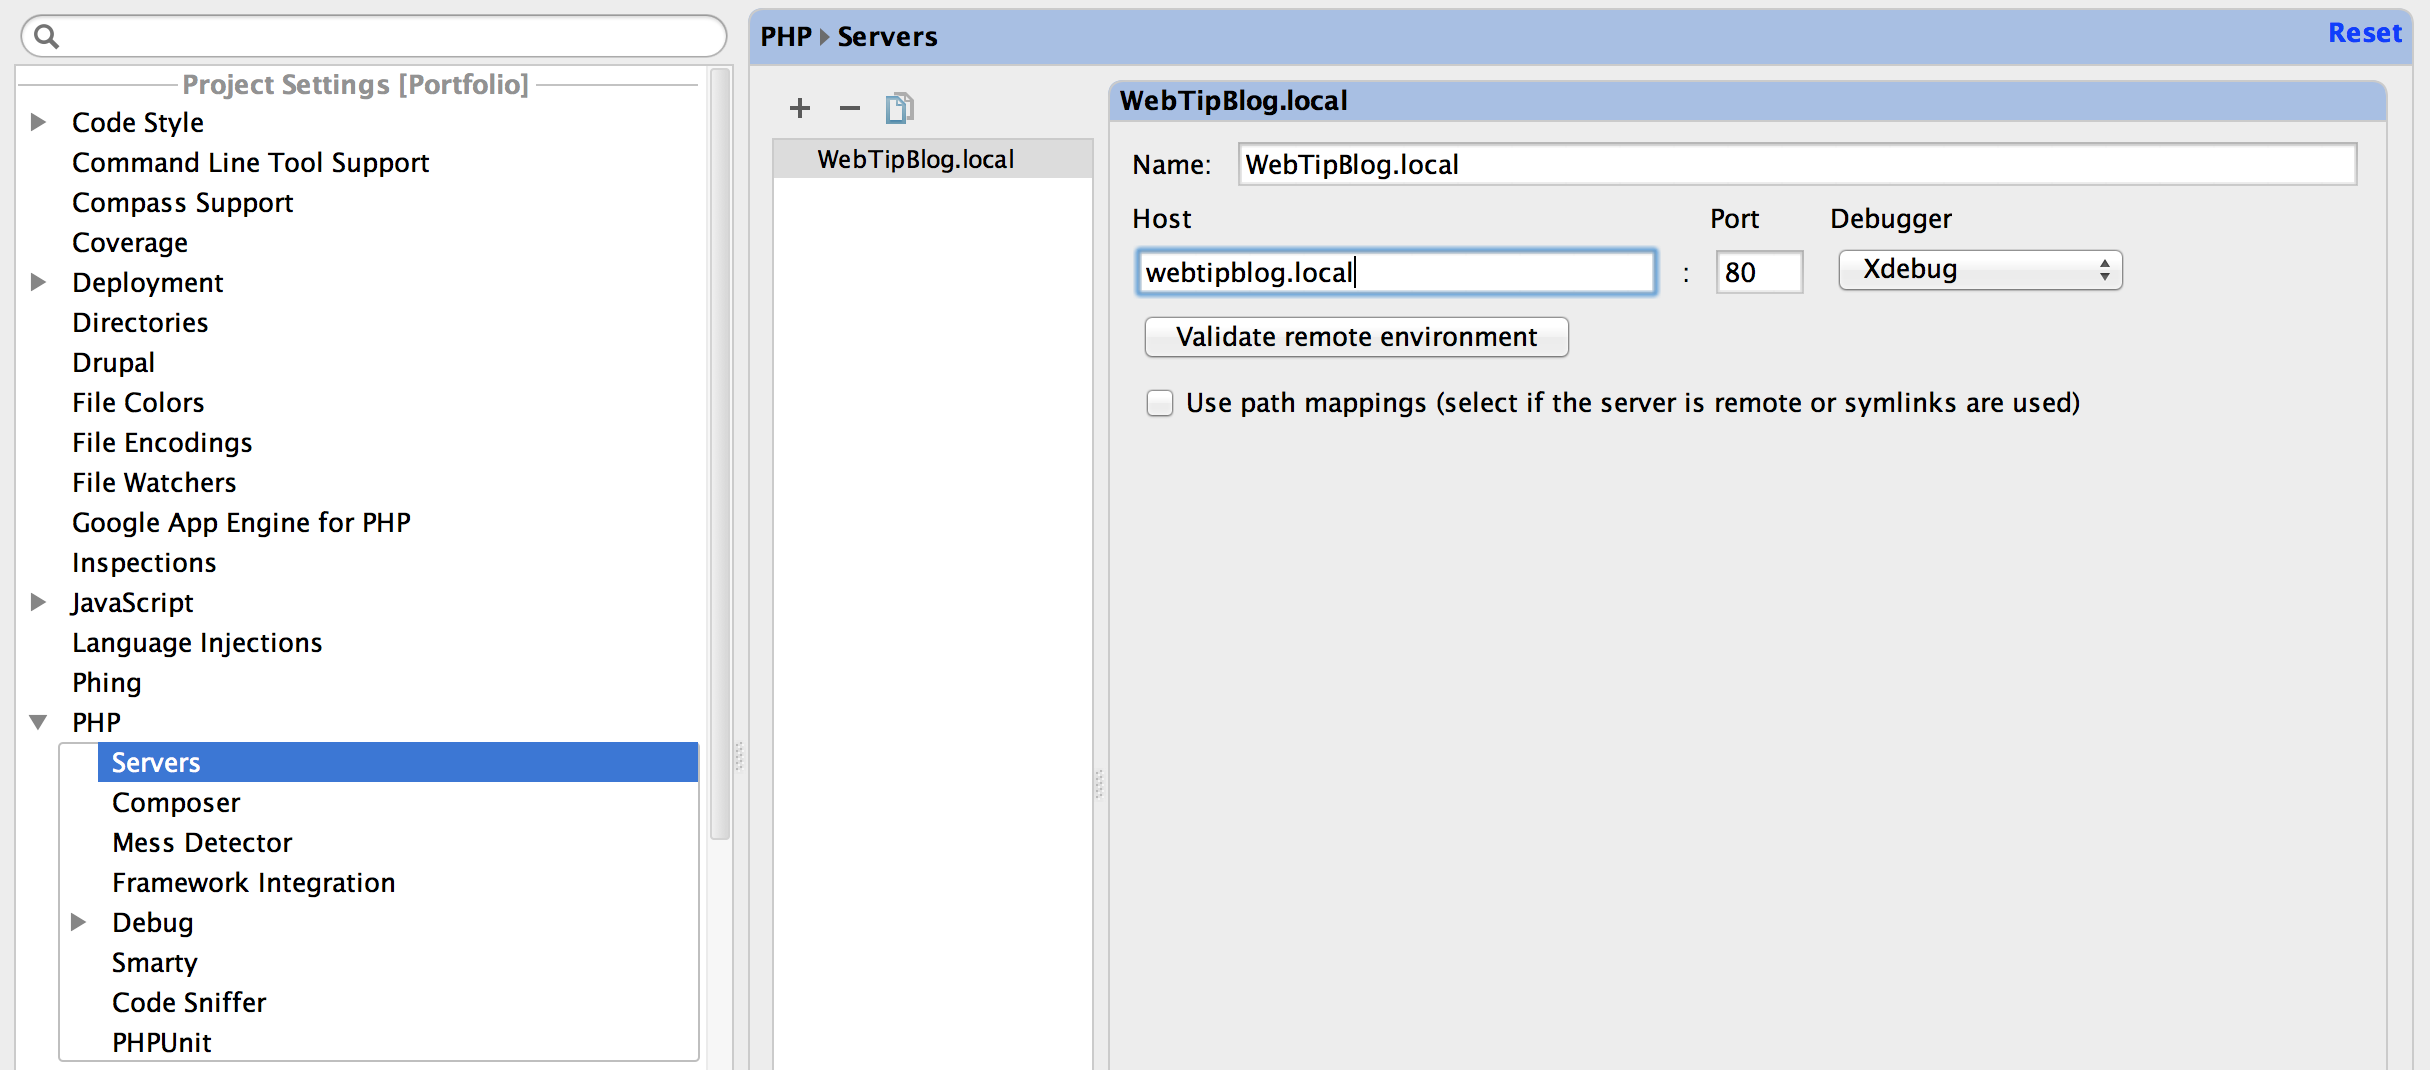
If this is not done then PHPStorm will not be able to listen for a connection with the server for debugging. Open Preferences->PHP->Servers to open the server configuration dialog. Click the ‘+’ icon to add a new server and configure to your settings.
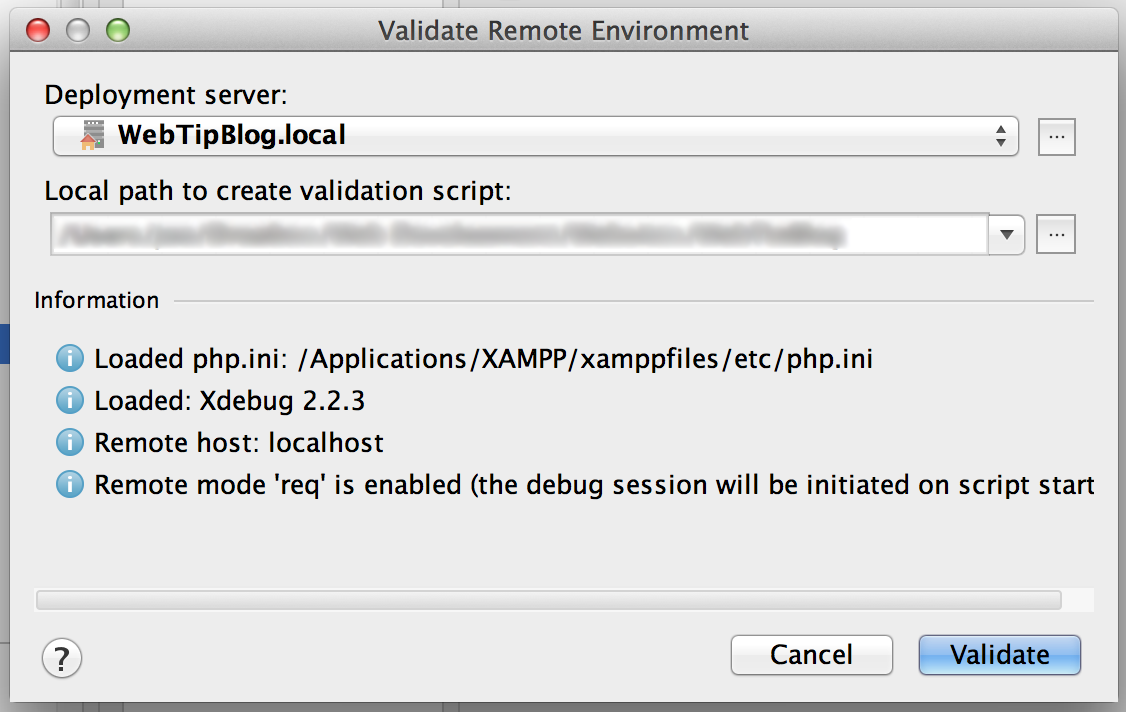
After you configure the PHP server, it is crucial to validate your settings; this can be done by clicking the “Validate remote environment” button. In the Validate Remote Environment dialog simply click validate, if you see errors correct them now.
You may need to edit your path mappings in this window. This is used if you’re using symlinks or if your files reside on a remote server. I actually ran into an error on my local environment where my breakpoints would trigger on index.php but no other breakpoints in other files would work. But remote debugging was working, I coul use xdebug_break(); to programmatically force a break point. The issue was that I had an upper case letter in a file path and Apache/PHP/Xdebug was passing the filename in lower-case to PHPStorm so the breakpoint never triggered. The solution for me was to set a path mapping to map the lower-case path to the actual path.
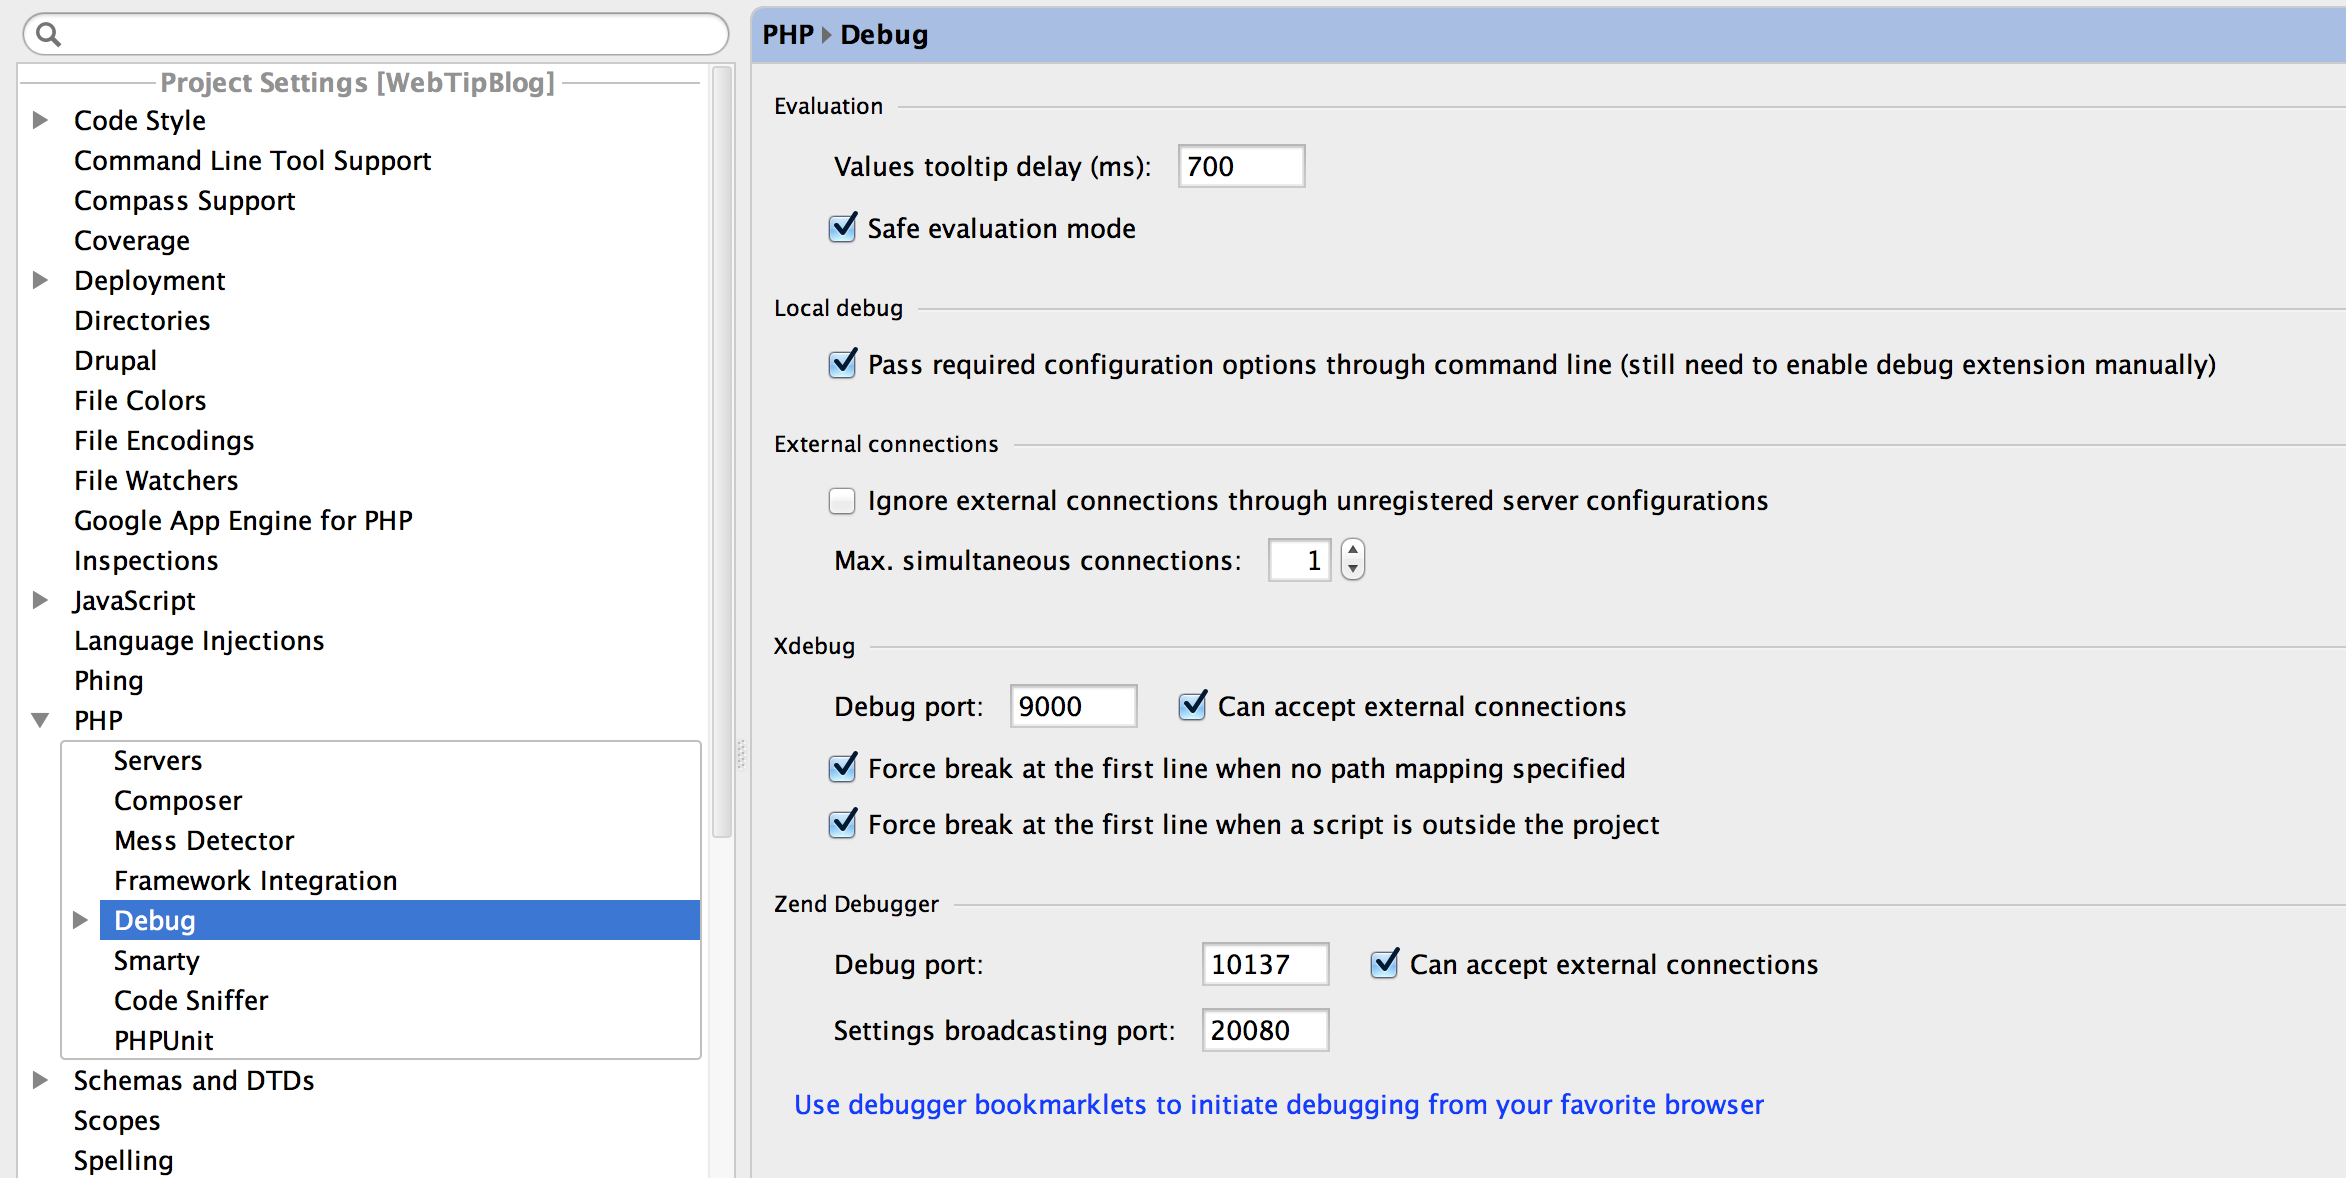
Now, it’s time to configure debugging; go to Preferences->PHP->Debug. Make sure your Xdebug port is set to 9000 and that “Can accept external connections” is checked. Now click the link at the bottom of the page that says “User debugger bookmarklets to initiate browsing from your favorite browser.” This will open a page/tab in your browser with links to start/stop debugging. Essentially these links set or remove a cookie that is used by Xdebug to include debugging information. If you use Chrome, there is a nice extension available called Xdebug Helper. Use either the link or the Chrome extension to enable debugging in the browser.
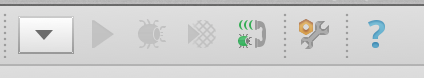
The next step is to go to PHPStorm and listen for debugging connections. This is done by clicking the icon in the toolbar that looks like a telephone. The icon should be full green if PHPStorm is listening for connections.
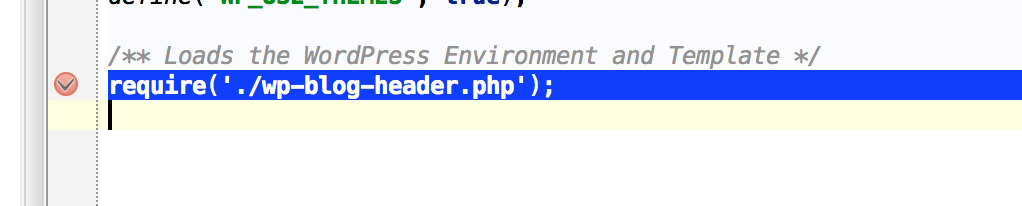
Now set a breakpoint in your application, I like to start at index.php just to test connectivity. To set a breakpoint click in the gutter to the left of the text editor window until a red bubble appears.
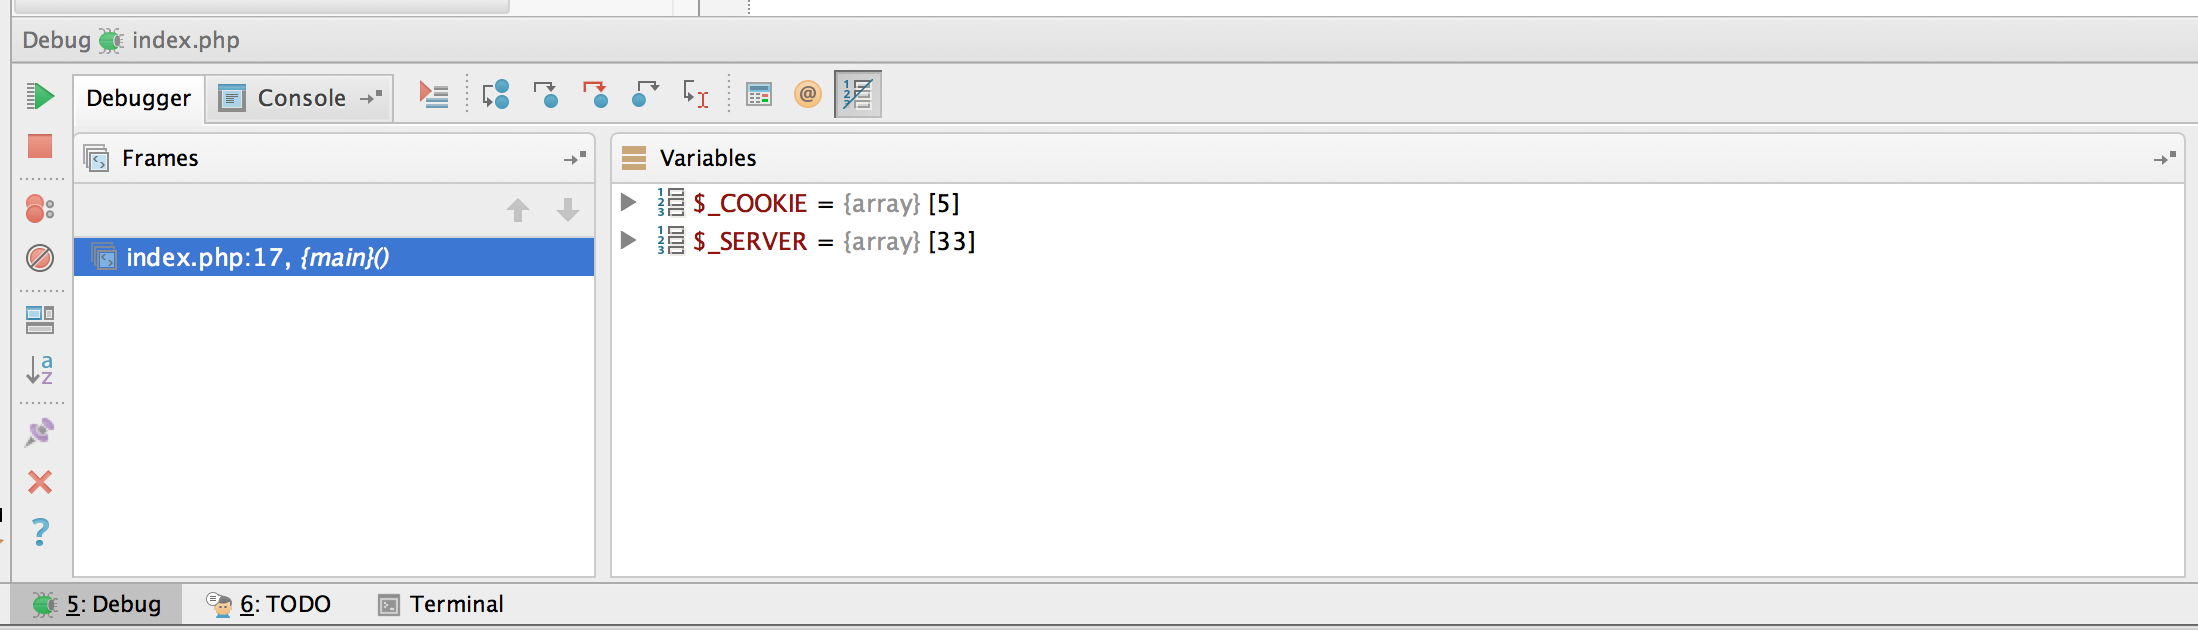
Now navigate to your browser and open a file with a breakpoint. On the first page load PHPStorm will open a dialog asking if it should accept the connection, accept the connection. The lower debug panel will open up and you should see debugging information including the file name and line number of the breakpoint, and all of the PHP variables that have been set. The beauty is that you can dive to any level of an object or array to see the full state of your application, something that is difficult to do with var_dumps(). To advance to the next breakpoint or continue page loading, click the green play button.
When I originally left a comment I seem tto have clicked thee -Notify me whhen new
omments are added- checkblx and now each time a comment is added I get 4 emails with the exact same comment.
There has to be a means you can remove me from that service?
Kudos!